import math
math.tau > math.piTrueThis is a test blog post rendered using Quarto ❤️
With Quarto, I can render math:
\[\tau > \pi\]
…and I can calculate results:
import math
math.tau > math.piTrue… and I can show maps and plots:
import cartopy.crs as ccrs
import matplotlib.pyplot as plt

ax = plt.axes(projection=ccrs.NorthPolarStereo(central_longitude=-45))
ax.set_extent([-180, 180, 90, 40], crs=ccrs.PlateCarree())
ax.stock_img()

# TODO: Put some data on the map

plt.show()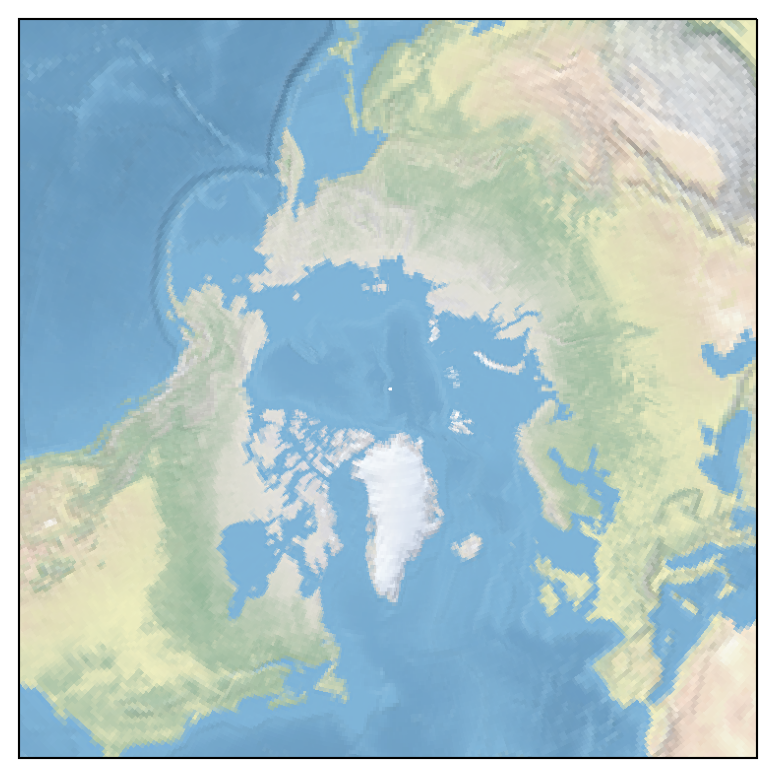
I’m a note!

This is bold text. This is italic text. This is also italic text.
print("I can do math! 1 + 1 = " + str(1+1))I can do math! 1 + 1 = 2